MDBenchmark: Benchmark molecular dynamics simulations


MDBenchmark — quickly generate, start and analyze benchmarks for your molecular dynamics simulations.
MDBenchmark is a tool to squeeze the maximum out of your limited computing resources. It tries to make it as easy as possible to set up systems on varying numbers of nodes and compare their performances to each other.
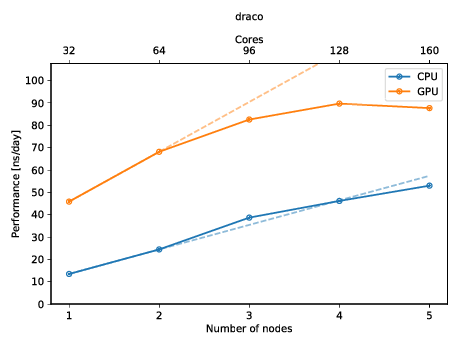
You can also create a plot to get a quick overview of the possible performance (and show of to your friends)! The plot below shows the performance of an molecular dynamics system on up to five nodes with and without GPUs.
Quick start
Follow the next two paragraphs to get a quick start. Extended usage guides can
be found below. You can install mdbenchmark with your favorite Python
package manager. Afterwards you are ready to use mdbenchmark.
Install
If you are familiar with the usual way of installing python packages, just use
pip:
pip install mdbenchmark
Anaconda users can install via conda:
conda install -c conda-forge mdbenchmark
Cutting-edge users may prefer pipenv:
pipenv install mdbenchmark
Usage
Now that the package is installed, you can generate benchmarks for your system.
Assuming you want to benchmark a GROMACS 2018.3 simulation on up to 5 nodes,
with the TPR file called md.tpr, run the following command:
mdbenchmark generate -n md --module gromacs/2018.3 --max-nodes 5
After generation benchmarks can be submitted:
mdbenchmark submit
Now, you can also monitor the status of your benchmark with mdbenchmark.
This will show you the performance of all runs that have finished. If you only wish to view
the data you can omit the --save-csv flag:
mdbenchmark analyze --save-csv data.csv
Finally, you can plot the data from your data.csv file with:
mdbenchmark plot --csv data.csv
Usage reference
mdbenchmark
Generate, run and analyze benchmarks of molecular dynamics simulations.
mdbenchmark [OPTIONS] COMMAND [ARGS]...
Options
-
--version¶ Show the version and exit.
analyze
Analyze benchmarks and print the performance results.
Benchmarks are searched recursively starting from the directory specified
in --directory. If the option is not specified, the working directory
will be used.
Benchmarks that have not started yet or finished without printing the performance result, will be marked accordingly.
The benchmark performance results can be saved in a CSV file with the
--save-csv option and a custom filename. To plot the results use
mdbenchmark plot.
mdbenchmark analyze [OPTIONS]
Options
-
-d,--directory<directory>¶ Path in which to look for benchmarks. [default: .]
-
-p,--plot¶ DEPRECATED. Please use ‘mdbenchmark plot’. Generate a plot of finished benchmarks.
-
--ncores,--number-cores<ncores>¶ DEPRECATED. Please use ‘mdbenchmark plot’. Number of cores per node. If not given it will be parsed from the benchmarks’ log file.
-
-s,--save-csv<save_csv>¶ Filename for the CSV file containing benchmark results.
generate
Generate benchmarks for molecular dynamics simulations.
Requires the --name option to be provided an existing file, e.g.,
protein.tpr for GROMACS and protein.namd, protein.pdb and
protein.psf for NAMD. The filename protein will then be used as the job
name, or can be overwritten with the --job-name option.
The specified module name will be validated and searched on the current
system. To skip this check, use the --skip-validation option.
Benchmarks will be generated for CPUs per default (--cpu), but can also
be generated for GPUs (--gpu) at the same time or without CPUs
(--no-cpu).
The hostname of the current system will be used to look for benchmark
templates, but can be overwritten with the --template option. Templates
for the MPCDF clusters cobra, draco and hydra are provided with the
package. All available templates can be listed with the --list-hosts
option.
mdbenchmark generate [OPTIONS]
Options
-
-n,--name<name>¶ Name of input files. All files must have the same base name.
-
-c,--cpu,-nc,--no-cpu¶ Use CPUs for benchmark. [default: True]
-
-g,--gpu,-ng,--no-gpu¶ Use GPUs for benchmark. [default: False]
-
-m,--module<module>¶ Name of the MD engine module to use.
-
-t,--template,--host<host>¶ Name of the host template.
-
--min-nodes<min_nodes>¶ Minimal number of nodes to request. [default: 1]
-
--max-nodes<max_nodes>¶ Maximal number of nodes to request. [default: 5]
-
--time<time>¶ Run time for benchmark in minutes. [default: 15]
-
--list-hosts¶ Show available host templates.
-
--skip-validation¶ Skip the validation of module names.
-
--job-name<job_name>¶ Give an optional to the generated benchmarks.
-
-y,--yes¶ Answer all prompts with yes.
plot
Generate plots showing the benchmark performance.
To generate a plot, you must first run mdbenchmark analyze and generate a
CSV file. Use this CSV file as the value for the --csv option in this
command.
You can customize the filename and file format of the generated plot with
the --output-name and --output-format option, respectively. Per default, a fit
will be plotted through the first data points of each benchmark group. To
disable the fit, use the --no-fit option.
To only plot specific benchmarks, make use of the --module, --template,
--cpu/--no-cpu and --gpu/--no-gpu options.
A small watermark will be added to the top left corner of every plot, to
spread the usage of MDBenchmark. You can remove the watermark with the
--no-watermark option.
mdbenchmark plot [OPTIONS]
Options
-
--csv<csv>¶ Name of CSV file to plot.
-
-o,--output-name<output_name>¶ Filename for the generated plot.
-
-f,--output-format<output_format>¶ File format for the generated plot. [default: png]
Options: png|pdf|svg|ps
-
-m,--module<module>¶ Name of the MD engine module(s) to plot.
-
-t,--template,--host<template>¶ Name of host templates to plot.
-
-g,--gpu,-ng,--no-gpu¶ Plot data of GPU benchmarks. [default: True]
-
-c,--cpu,-nc,--no-cpu¶ Plot data of CPU benchmarks. [default: True]
-
--plot-cores¶ Plot performance per core instead performance per node. [default: False]
-
--fit,--no-fit¶ Fit a line through the first two data points, indicating linear scaling. [default: True]
-
--font-size<font_size>¶ Font size for generated plot. [default: 16]
-
--dpi<dpi>¶ Dots per inch (DPI) for generated plot. [default: 300]
-
--xtick-step<xtick_step>¶ Override the step for xticks in the generated plot.
-
--watermark,--no-watermark¶ Puts a watermark in the top left corner of the generated plot. [default: True]
submit
Submit benchmarks to queuing system.
Benchmarks are searched recursively starting from the directory specified
in --directory. If the option is not specified, the working directory
will be used.
Requests a user prompt. Using --yes flag skips this step.
Checks whether benchmark folders were already generated, exits otherwise.
Only runs benchmarks that were not already started. Can be overwritten with
--force.
mdbenchmark submit [OPTIONS]
Options
-
-d,--directory<directory>¶ Path in which to look for benchmarks. [default: .]
-
-f,--force¶ Resubmit all benchmarks and delete all previous results.
-
-y,--yes¶ Answer all prompts with yes.